Hoping you guys went through the last post (Lnk -> Getting Started with Graphlab), In this post we will do some handson SFrame datatype of Graphlab which is same as dataframe of pandas python library.
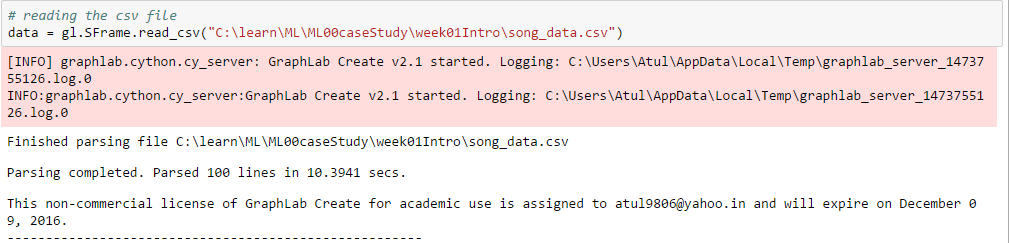
i. Reading the CSV file
==
ii. save DataSet
==
iii. load DataSet
==
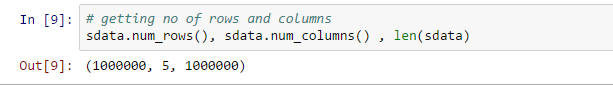
iv. Check Total Rows and Columns
==
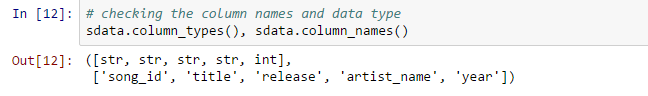
v. Check Columns data type and Name
==
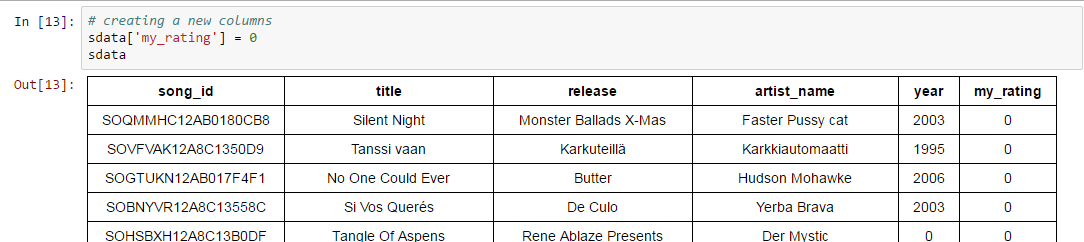
vi. Add new column
==
vii. Delete column
==
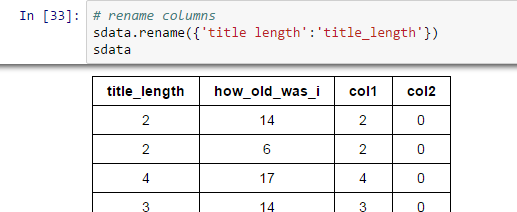
viii. Rename column
==
ix. Column Swapping (location)
==
https://www.facebook.com/datastage4you
https://twitter.com/datagenx
https://plus.google.com/+AtulSingh0/posts
https://datagenx.slack.com/messages/datascience/

No comments:
Post a Comment